How good we really are

“Good” or “bad”

If someone tells you that a certain service is “really good”, you had better take a closer look.

“Good” or “bad” are relative concepts, so -especially when dealing with the responsibility of making the best possible decisions- one needs to know with respect to what such service is good or not so good! The right approach is to say something like “the service is good at discriminating between key values” or “at reliably reproducing past similar events”. It must always be indicated which reference or attribute is used to consider the service “good”.

In fact, a particular service (satellite-based, or forecast-based, it does not matter how it is built) can be excellent for certain decision makers, and be completely useless to others. For example, a service indicating that the next month is going to be wet, might be completely useless to certain farmers needing to know if a certain amount of rain will happen at the beginning, the middle or the end of next month. How can then the quality of that service be described in general as good, when it depends on the actual demand of the decision maker?

Alisios’s premise is that each client is part of a unique ecosystem, so its needs are also unique, and hence the services and how the quality of such services are defined and measured cannot be generalised. We can share with you how good certain services we provide are, but it will be misleading to assume that is how good your services are.

Instead, we produce tailored retrospective forecasts (past forecasts, or hindcasts) of the actual variable(s) you need, and present a variety of metrics that evaluate multiple dimensions of “how good” your particular service is. Hence, our clients have well-defined, objective and tailored ways to assess the “goodness” of the service we provide them, for each time scale, location, spatial resolution and application of interest.

Recent evaluations

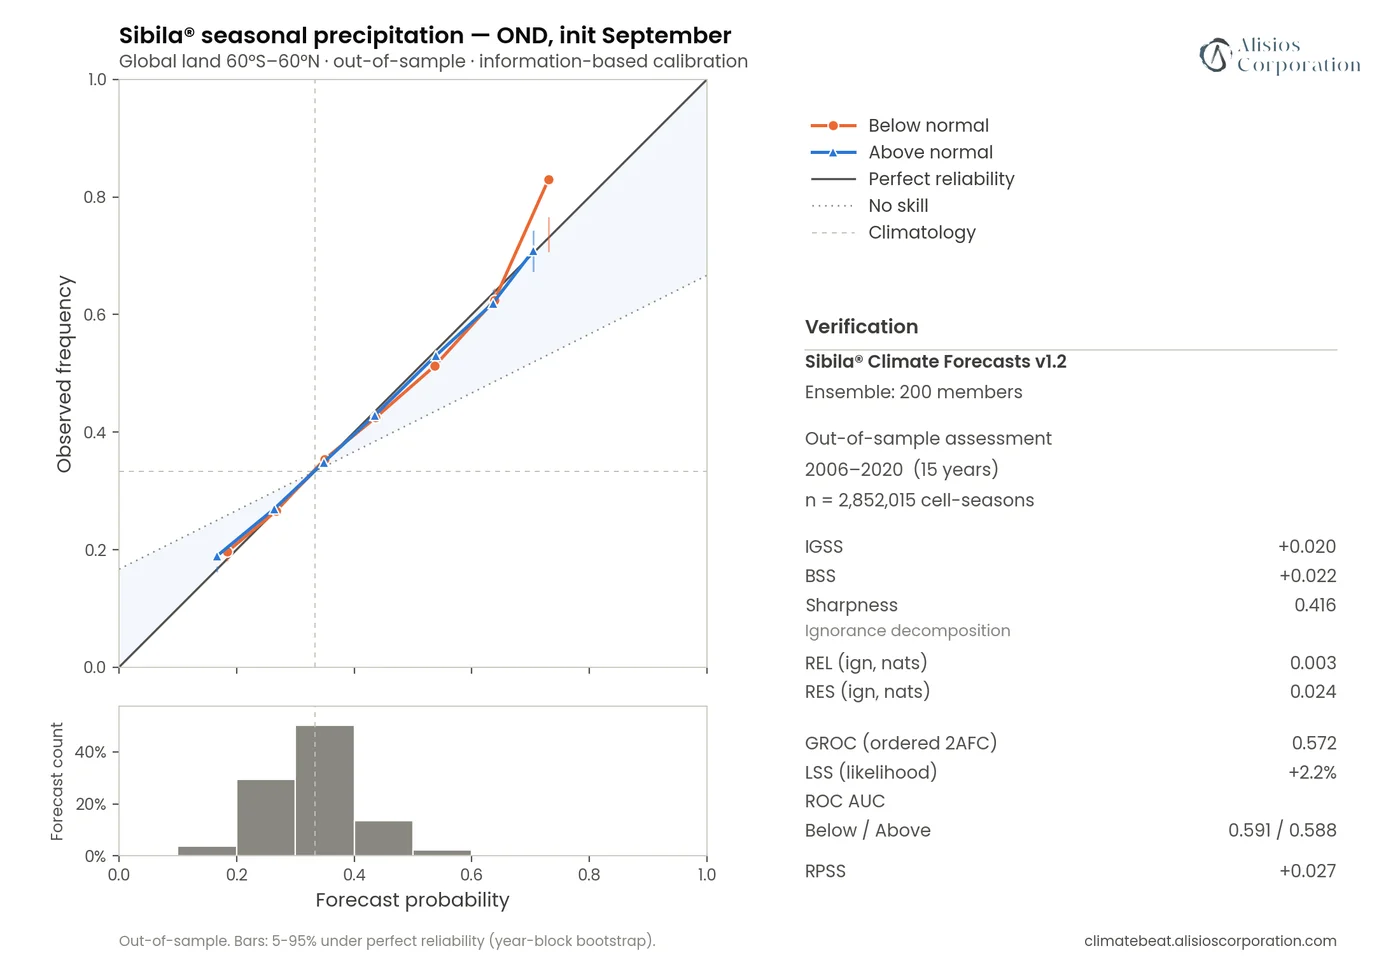
Sibila® seasonal precipitation, October–December, forecast issued in September. Global land 60°S–60°N, out-of-sample 2006–2020, 2.85 million cell-seasons. When Sibila® says 40 %, the outcome happens about 40 % of the time: the curves sit on the diagonal (reliability term 0.003 nats). Skill over climatology is modest and honest: IGSS +0.020, RPSS +0.027.
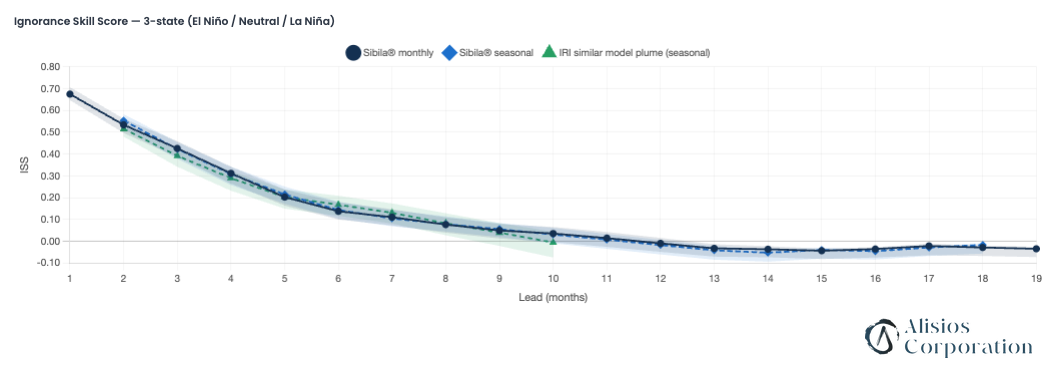
ENSO-XTI: three-state (El Niño / neutral / La Niña) ignorance skill score by lead time. Sibila® monthly and seasonal forecasts alongside the IRI plume of comparable models: skill around 0.5 at two months, positive to about ten months, on par with the IRI plume. <a href="https://enso.alisioscorporation.com" target="_blank" rel="noopener">Sibila® ENSO-XTI</a>.
ENSO-XTI: three-state (El Niño / neutral / La Niña) ignorance skill score by lead time. Sibila® monthly and seasonal forecasts alongside the IRI plume of comparable models: skill around 0.5 at two months, positive to about ten months, on par with the IRI plume. Sibila® ENSO-XTI.
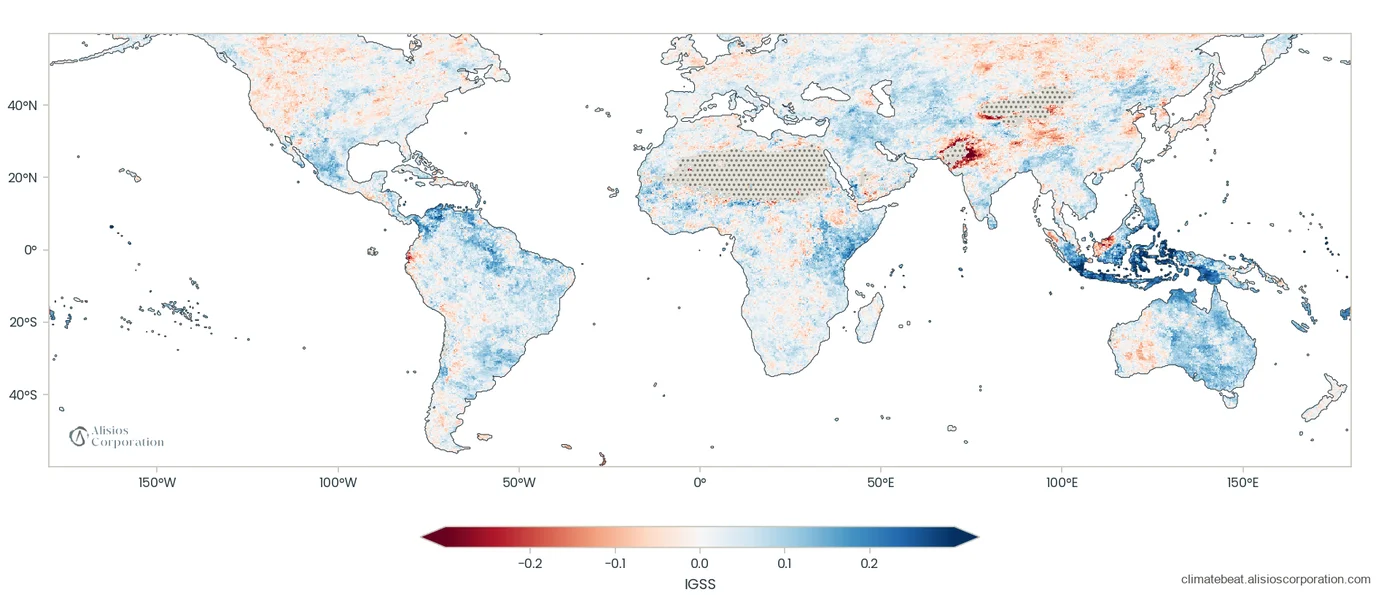
Example: where the seasonal rainfall forecast adds information (blue) and where it does not (red), as ignorance skill score against climatology. The map changes with the start month and lead time; all of them are on the verification page of <a href="https://climatebeat.alisioscorporation.com" target="_blank" rel="noopener">Sibila® ClimateBeat</a>.
Example: where the seasonal rainfall forecast adds information (blue) and where it does not (red), as ignorance skill score against climatology. The map changes with the start month and lead time; all of them are on the verification page of Sibila® ClimateBeat.